Snapshot
Despite the volatility at the start of August, growth assets mostly moved higher through the month, with the MSCI World Index increasing by 2.51%. At the beginning of the month, global equities dropped considerably, with the Japanese equity market leading the way. The TOPIX fell 12% in a single day, marking its largest one-day decline since the 1980s. The Bank of Japan’s (BOJ) interest rate hike and the unwinding of the Japanese yen carry trade were deemed the culprits of the move, and violent market action saw a number of players stopped out. From a fundamental perspective, the Japanese market still appears relatively cheap as the price-to-earnings (P/E) ratio trades around its long-term average, and the market still expects earnings to rise over the coming years. The Japanese market could remain volatile due to its historically high correlation with the yen and as the US-Japan interest rate differential is set to narrow, keeping upward pressure on the yen. Outside of Japan, the sell-off was not as harsh, with the S&P 500 dropping 6% before ending the month with a gain of 2.3%.
Outside of equities, the bond market rallied, with the Bloomberg Global Aggregate rising 2.76%. The 10-year Treasury yield dropped by 12 basis points (bps) to end the month at 3.90%. During the month, the market continued to price interest rate cuts from the US Federal Reserve (Fed), as the US unemployment rate rose by 0.2% to 4.3% and the inflation rate dropped to 2.9% year-on-year (YoY). Within this background of equity market volatility and slowing employment, the bond market adjusted its one-year cash rate expectations for the Fed to below 3.50%. Within currencies, the US dollar sold off, while the yen continued its ascent in August, strengthening from the 149 to the lower 140 level against the dollar. As interest rate differentials shift into Japan’s favour with BOJ rate hikes and Fed cuts, the yen is likely to continue appreciating in the near term.
Cross-asset1
For the month of August, we maintained our overweight growth position and a neutral position on defensives. Several positive factors continue to support our optimism towards growth assets, including the first rate cut from the Fed in September, earnings surprises remaining above their historic average, US economic growth beating expectations, and large fiscal spending globally from governments to support growth. Additionally, with inflation ebbing globally and unemployment inching higher, a number of central banks will now be inclined to ease mode for the foreseeable future, creating a positive environment for defensive assets. Typically, growth assets perform well in such an environment, and in this month’s Balancing Act, we look at how the equity market performs at the start of a rate-cutting cycle.
Within the cross-asset scores of growth, we remain overweight in developed market (DM) equities and rebalanced our risk exposures by adding to UK and Singapore, which tend to be more defensive. We reduced our weight in Japan while retaining our preference for the US on the back of better visibility stemming from secular growth themes. Despite moving to a neutral stance on the near-term headwinds of yen appreciation, we continue to like Japan for its longer term structural story of improving corporate governance and earnings growth momentum. As such, we would look to slowly add capital on market corrections. We reduced our overweight position in commodity equities to neutral as we see headwinds to the subsector with electric vehicles and hybrid electric vehicles dominating new car sales. Within commodity equities, we decreased our overweight in energy given growing oversupply amidst slowing demand and continue to like the more defensive MLP assets. Within infrastructure, we added weights to UK REITs (which are classified under infrastructure) on attractive valuation amidst the start of the rate-cut cycle to reflect our constructive view on the asset class. We also moved to an overweight position in emerging market (EM) equities, spurred by a weaker US dollar, which would likely benefit EMs. We maintain our preference for specific countries, such as India and Indonesia, which stand to benefit from a domestically-driven economy and structural long-term growth story.
Within defensives, we kept investment-grade (IG) credit slightly overweight, while increasing DM sovereigns to a smaller underweight. While IG credit spreads remain tight with certain countries (such as the US) trading close to the post-global financial crisis (GFC) lows, we expect the potential for rate cuts to be supportive of spreads. We see Canada offering relatively more attractive spreads and a dovish central bank, which should support both spreads and outright interest rates. For DM sovereigns, we have been adding back duration in the US and more recently, we upgraded China as the cost to currency hedge the position dropped considerably. Encouragingly, both countries will likely need to cut rates, and this should also generate positive bond market returns through the end of the year. We kept our High Yield score at an overweight, with the high all-in yields on offer making the asset class attractive.
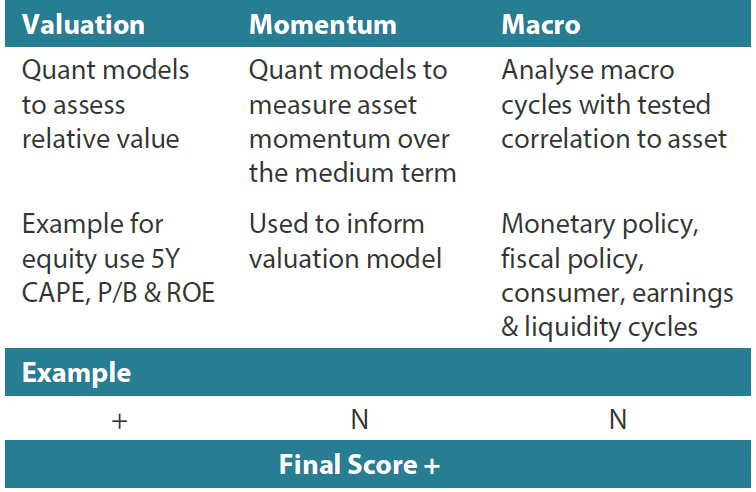
1 The Multi Asset team’s cross-asset views are expressed at three different levels: (1) growth versus defensive, (2) cross asset within growth and defensive assets, and (3) relative asset views within each asset class. These levels describe our research and intuition that asset classes behave similarly or disparately in predictable ways, such that cross-asset scoring makes sense and ultimately leads to more deliberate and robust portfolio construction.
Asset Class Hierarchy (Team View2)
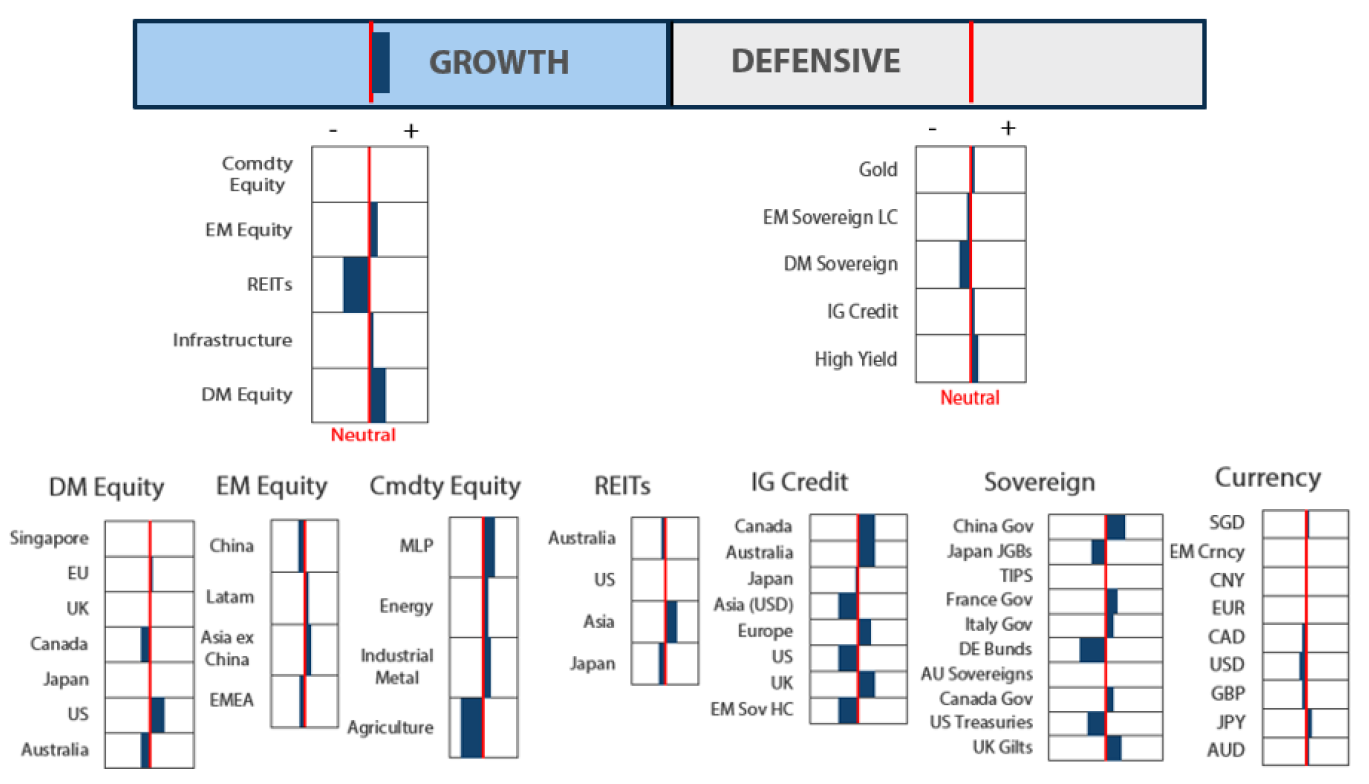
2The asset classes or sectors mentioned herein are a reflection of the portfolio manager’s current view of the investment strategies taken on behalf of the portfolio managed. The research framework is divided into 3 levels of analysis. The scores presented reflect the team’s view of each asset relative to others in its asset class. Scores within each asset class will average to neutral, with the exception of Commodity. These comments should not be constituted as an investment research or recommendation advice. Any prediction, projection or forecast on sectors, the economy and/or the market trends is not necessarily indicative of their future state or likely performances.
Research views
Growth assets
Despite recent volatility—as market expectations for the Fed’s rate cut in September fluctuated between 25 and 50 bps—growth assets remain attractive. Sentiments remain jittery over whether good economic data should be viewed as negative or positive. Likewise, investors are pondering whether good economic data is indeed good or bad economic data is detrimental, as it could affect how aggressively the Fed moves rates. Regardless, we believe that the longer-term outcome of inflation declining towards the Fed’s target while economic data remains resilient are supportive of risk assets. The start of a rate-cutting cycle to normalise monetary policy is a powerful driver of returns—a welcome departure from the impact of restrictive monetary policies implemented over the past few years. We view any current market corrections as attractive entry points to augment positions on the longer-term secular growth story.
Historical view of what happens when the Fed begins cutting rates
When we look through history and observe what happens to the S&P 500 when the Fed first cuts rates, we find that it largely depends on whether the reductions were due to policy rate normalisation or a recession. Since 1984, equities on average tended to rise during past rate-cutting cycles when the easing was driven by the former after a period of restrictive monetary policy and slowing growth, albeit not in recessionary conditions. On the other hand, when the Fed cut rates while the economy was heading into a recession, which is not our base case, equity markets tended to decline in the subsequent quarters.
Chart 1: S&P 500’s average performance following past Fed rate cuts
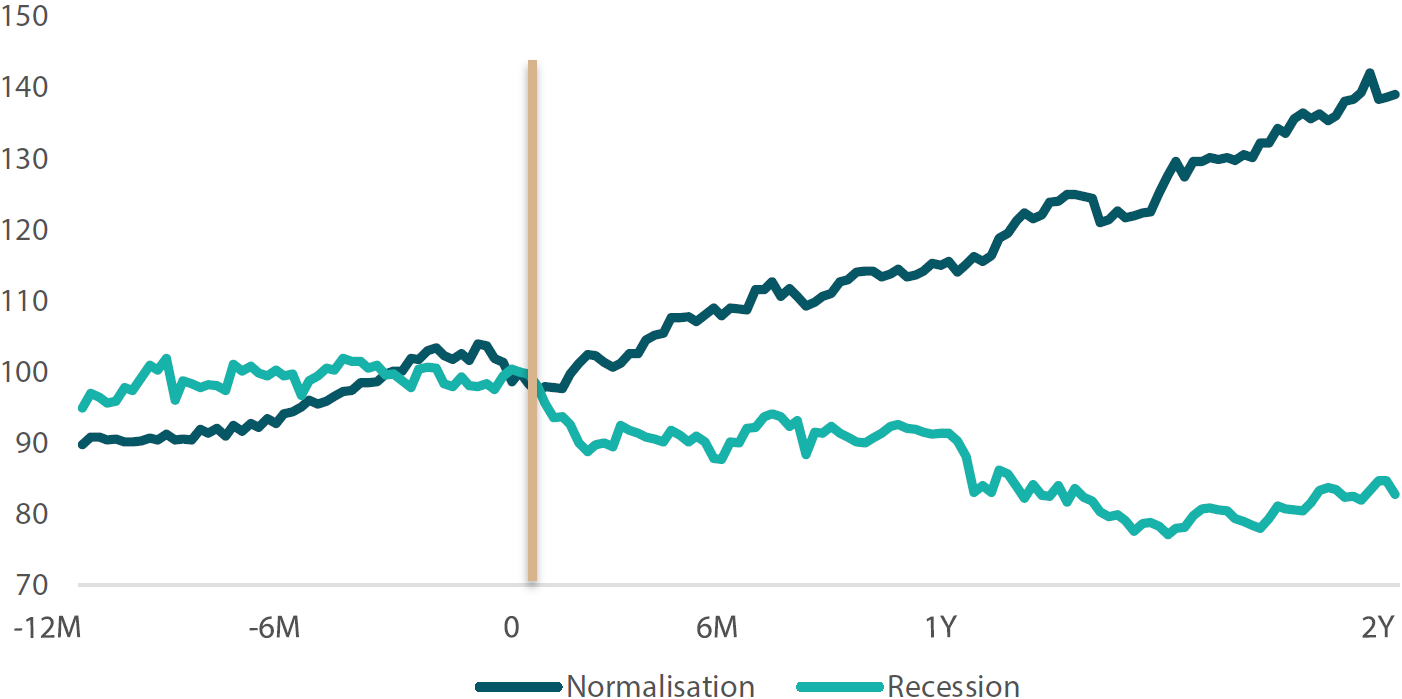
Value set at 100 for the initial interest rate cut.
Source: Bloomberg, September 2024
The Fed’s easing cycle will likely be driven by a “soft landing” scenario where inflation is easing, unemployment is low and GDP growth remains strong. While market expectations were split until the end regarding how deep the cut in rates would be at the 18 September Federal Open Market Committee (FOMC) meeting, we expect the outcome, which saw the Fed lower rates by 50 bps, to be positive as the markets are pricing more than 200 bps of easing by the end of the cycle. We are agnostic on if the Fed eases one or two times in 2024, and we believe that once the easing cycle is initiated investors would take a risk-on stance regardless of how many times the central bank may opt to cut rates through the remainder of the year.
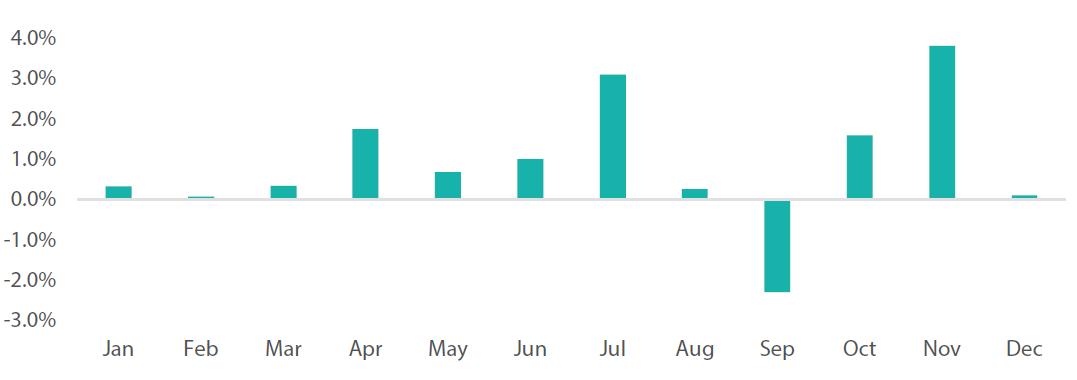
Chart 2: S&P 500’s average returns by month over the past 10 years
Source: Bloomberg. September 2024
In the past ten Septembers, the S&P 500 has fallen 7 times (or 70% of the time), with an average return of –2.3% over the period. September is the only month that has consistently registered a negative return compared to the other calendar months. This trend is intact even when the observation period is extended to the past 20 years, with September remaining weakest month of the year. Notable September bear markets include the Global Financial Crisis in 2008 and, more recently, in 2022.
Theories abound on why September is a particularly weak month for equities. One such theory is that investors tend to sell stocks to participate in the flurry of bond offerings that usually come at this time of the year. Other theories include summer vacations schedules in the US, where traders tend to close their trades before going on holiday, contributing to the seasonal weakness. A more peculiar explanation is that September’s performance is a consequence of seasonal affective disorder; the arrival of autumn means fewer hours of daylight and this supposedly causes negative mood swings in investors. A simpler explanation is that it is simply a self-fulfilling prophecy where investors stay out of the markets given its historical record of weakness. Regardless, while we are mindful that while “history doesn’t repeat itself, it often rhymes”, we are conscious of the near-term volatility that September might bring. However, we maintain our view that risk assets will end the year on a positive tone.
Conviction views on growth assets
Maintained exposure to US secular growth: We continue to like US tech-related stocks despite the recent risk-off sentiment that hit the sector. Corporate earnings have been resilient, and the secular long-term growth story for the sector remains intact. Within the US, we are also starting to see the rally widening beyond the “Magnificent 7” which is positive for the overall market. As the economy slows and inflation is subdued amidst a more dovish monetary policy, we expect risk assets to perform well in US.
Increased exposure to EMs: We shifted to an overweight position in EMs based on relative valuation. The start of a rate cut cycle in the US, which historically tends to weaken the dollar, is typically positive for EMs. We favour selective markets in India and Indonesia, which benefit from domestically driven economies and have structural long-term growth stories. Likewise, we view Taiwan favourably for its exposure to the global technology upcycle and as a beneficiary of a weaker dollar.
Reduced Japanese equities: We reduced our weight in Japanese equities to neutral with volatility increasing on the back of recent yen appreciation. We still like the structural reform story where we expect companies to start deploying their capital either via capex or returns to shareholders. However, the volatility of the yen and a hawkish BOJ, which puts it in contrast with its dovish global peers, also pose headwinds to market sentiment. We will take a more positive on the country once we see the currency stabilising at a higher level.
Toned down commodity-linked equities: In light of the heightened volatility, we reduced our exposure to the asset class, shifting the weights into more defensive asset classes such as MLPs and US utilities. We remain confident that the asset class will continue to provide good diversification against inflation in the longer term, but we tactically reduced our weights because of the anticipated near-term volatility. The sector’s fundamentals remain compelling due to both cyclical and secular factors.
Defensive assets
Two of the main changes to our defensive scores this month were an increase to DM Sovereigns and Chinese Government bonds. Currently the portfolios are positioned with a slight overweight to duration—primarily due to an overweight in IG credit which includes securities with longer durations than our benchmark— in order to take advantage of the rate cuts that are occurring across the globe, with the recent spate of data having pointed to the US joining its peers in September. And despite our view over the past six months that the Fed would not be as dovish as the market expects, we have recently been increasing our USD duration to take advantage of the beginning of the rate-cutting cycle. In addition to this, the currency hedging cost of owning Chinese bonds has dropped considerably, giving the Chinese sovereigns a clear yield advantage over other DMs, creating an opportunity to generate yield in portfolios while also providing diversification.
Chinese bonds, hedging costs and the yuan
Over the past twelve months, while global sovereign bonds have been selling off, Chinese bonds have rallied as a soft economy and low inflation pushed yields lower. Despite being stable over the past four years, Chinese yields, when accounting for hedging costs, have been extremely volatile. For an investor based in Japan who hedges currency risk, this has seen Chinese bonds yielding as low as -2% in early 2024, and as high as 1.29% in 2020. More recently, despite Chinese bond yields declining alongside their global market peers, the hedged yields available have risen considerably as the cost to hedge has plummeted. This has made Chinese government bonds relatively attractive from a carry perspective, even stacking up well against short-dated credit.
Chart 3: China bond yields—hedged and unhedged
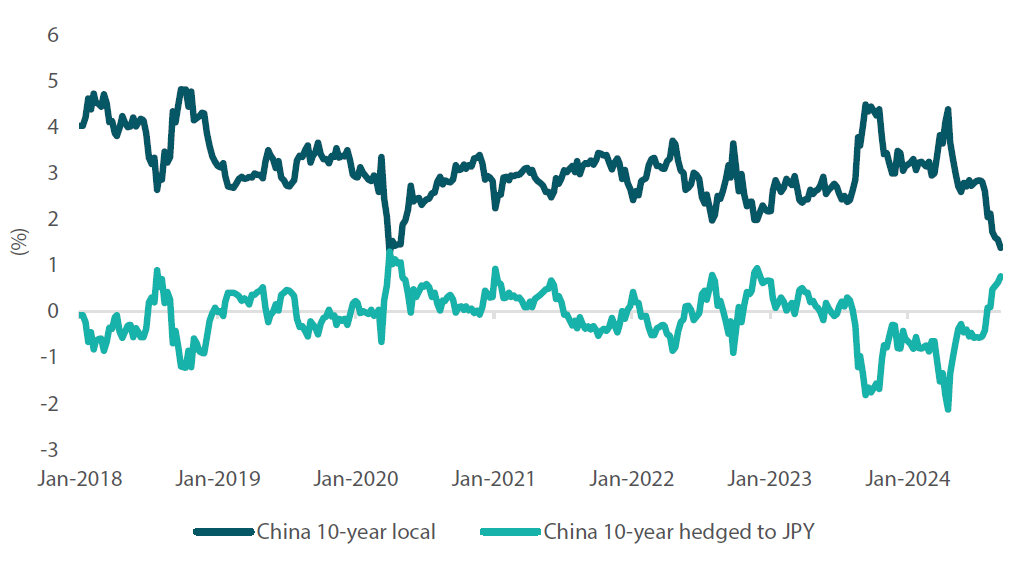
Source: Blomberg September 2024
Interestingly, this decline in hedging costs has occurred as the short yen carry trades were unwound. Over the past 12 months, it appears that China has been actively trying to defend its currency, as lower yields across Asia compared to the US has created historically wide interest rate differentials. Chart 4 below shows that while financial markets have been focused on the yen’s weakness since 2022, China was also drawn deeply into the same dynamics. This has likely created some concern for China to ease rates despite the state of the property market as it could have put too much pressure on their currency. On a positive note, as US rates begin to fall, this may allow the Chinese government to take a more expansionary stance without exacerbating interest rate differentials.
Chart 4: Chinese yuan (CNH) and Japanese yen (JPY) against the US dollar
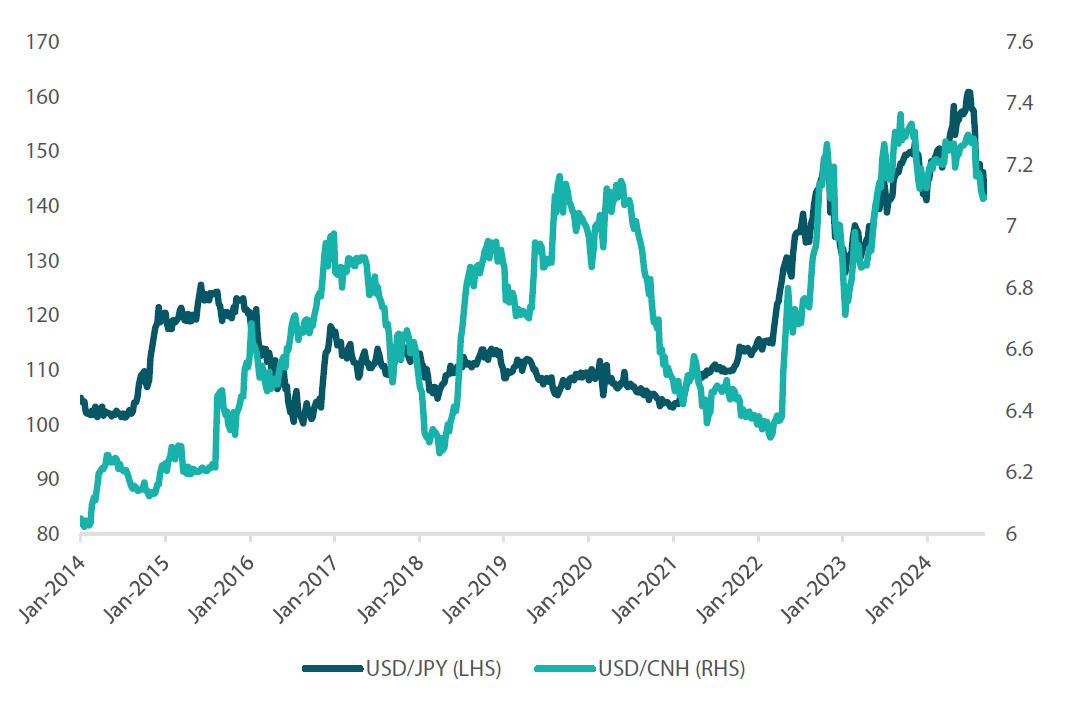
Source: Bloomberg, September 2024
From a portfolio perspective, we think that these dynamics create an opportunity in Chinese government bonds. For those who are seeking carry, Chinese bonds now offer some of the strongest yields available in the sovereign market. We expect the yen to continue gaining as the interest rate differentials between the US and Japan narrows. This may also prove positive for the yuan and allow the positive carry to remain in the bond market. Additionally, while the correlation between US bonds and equities became positive through 2021–2023, Chinese bonds kept a very low correlation with equities during the same period. This provided diversification to portfolios and offered a defence ballast when DM sovereign bonds declined. Given China is still struggling to generate growth and property prices continue to decline, we expect the market to retain its defensive properties in the short to medium term. Accordingly, the sovereign market will remain in favour within strategic asset allocations.
Conviction views on defensive assets
Short-dated IG credit: Credit spreads remain at fair levels, but many markets still exhibit inverse yield curves, making longer-dated credit less appealing. As curves begin to steepen, we will look to shift this position. However, the current curve inversion still makes short-dated IG credit appealing.
Gold remains an attractive hedge: Gold has been resilient in the face of rising real yields and a strong dollar, while proving to be an effective hedge against geopolitical risks and persistent inflation pressures.
Adding duration: As central banks begin to ease rates, this should be beneficial to bond markets globally. Picking the timing for cuts can be difficult; however, an end to restrictive policies should be positive for bonds.
Process
In-house research to understand the key drivers of return: