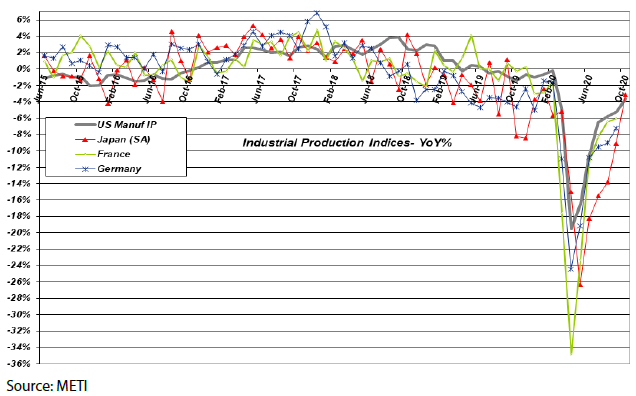
For October, on a seasonally adjusted YoY basis, Japan’s October YoY Industrial Production (IP) result was better than both US Manufacturing IP and US Total IP. It likely surpassed Europe’s too.
It should be noted that Japan had a notably weak (post VAT hike) base last October, but all said, the MoM increase was very strong, beating consensus (3.8% vs 2.4%), and was very V shaped.
Production was led by capital goods and automobiles, with the latter reflecting the strong upturn in global auto sales, especially in high value-added luxury and SUV segments, which also happen to be very profitable for most automakers. The capital goods improvement, meanwhile, is a good indication of machinery capex growth in many countries’ CY4Q GDP statistics ahead.
This chart of IP levels is rebased to 100 in October 1998 and shows both long term and short term trends, in particular the recent V shape of Japan’s IP:
This material has been prepared solely for the purposes of Nikko AM to communicate about the market environment, etc. It is not solicitation for a specific fund. Moreover, the information in this material will not effect Nikko AM's fund investment in any way.
Mentions of individual stocks in these materials neither promise that the stocks will be incorporated nor constitute a recommendation to buy or sell. The information in these documents have been prepared from what is considered to be reliable information but the accuracy and integrity of the information is not guaranteed by the Company. Figures, charts, and other data in these materials are current as of the date of publication unless stated otherwise. In addition, opinions expressed in these materials are as of the date of publication unless stated otherwise.
* The graphs, figures, etc., contained in these materials contain either past or back-dated data, and make no promise of future investment returns, etc. These documents make no guarantee whatsoever of future changes to the market environment, etc.
Opinions expressed in these documents may contain opinions that are not Nikko AM's but the personal opinion of the author, and may be changed without notice.