This document was prepared by ARK Investment Management LLC.
ARK Bad Ideas Report 2020
Today, we believe the global economy is undergoing the largest technological transformation in history. Disruptive innovation should displace industry incumbents, increase efficiencies, and gain majority market share. As technologies emerge and transform entire industries, investors in traditional benchmarks may face more risk than historically has been the case.
To help investors stay on the right side of change, this white paper seeks to identify the industries and sectors most at risk of disintermediation and disruption. We aim to size investors’ current exposure to those areas.
Based on our research, we believe investors should evaluate and avoid the following "Bad Ideas"
I. Physical Bank Branches
For centuries, “financial organizations” have relied on physical distribution to attract and serve customers. In ancient Greece, money changers gathered in Athens’ ports while, in Italy during the 14th century, Bardi, Peruzzi and Medici organized physical branch networks. Meanwhile, in the 20th and early 21st centuries, financial institutions have evolved modern branch banking.
Now, however, the internet and smartphones are transforming the distribution of financial services. Thanks to cellular services, we believe smartphones are distributing financial services much more efficiently and cost-effectively. Digital wallets - bank branches in user pockets – are rendering expensive physical infrastructure useless, putting at risk hundreds of billions dollars of traditional financial institutions’ assets.
Estimated Investor Exposure
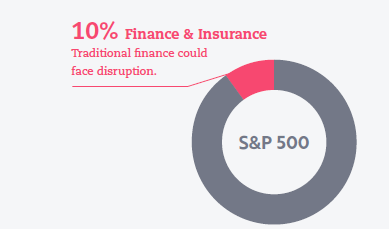
Finance and insurance account for roughly 8% of GDP in the United States1 and 10% of the S&P 500’s equity market capitalization. In other words, approximately $3 trillion of market capitalization is facing the threat of disintermediation.2
Consumer Banking Is Shifting From Brick-and-Mortar To Digital And Mobile
After tracking the usage of financial services across demographic factors such as income, occupation, and age between 2013 and 2017, the Federal Deposit Insurance Corporation (FDIC) reported a drop in the use of bank branches and an increase in digital and mobile banking.3
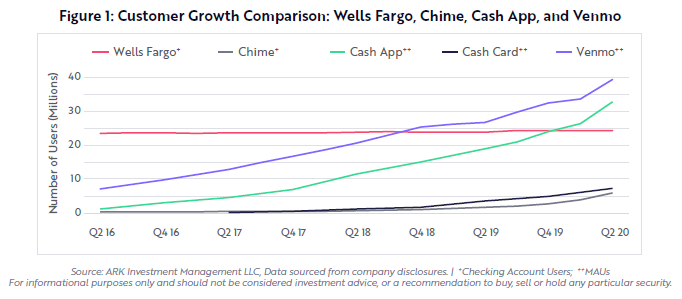
Seemingly, digital-only offerings such as Square’s Cash App, PayPal’s Venmo, Chime, and other digital wallets are benefiting more than banks from this change. When discussing their “Active Digital Users”, Wells Fargo, JP Morgan Chase and Bank of America disclose the percent of current customers using digital channels, but they do not disclose the extent to which digital is contributing to incremental customer acquisition. Wells Fargo, for example, has disclosed that its digital active user base increased by 4 million during the last four years but net new checking account customers rose only 800,000, as shown below.4 Over the same time period, challenger bank Chime increased its checking account users by 5.5 million, while the number of monthly active users (MAUs) shot up by 32 million on Venmo and 30 million on Cash App. Square also announced that active Cash Card5 users increased 7 million during the same time period. In our view, digital wallet users could become more valuable than Wells Fargo’s checking account customers during the next three to five years.
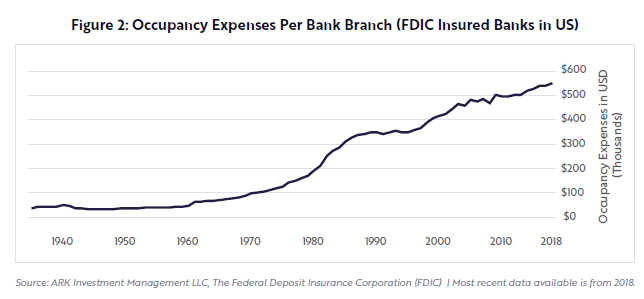
We believe the main reason for the explosive growth in digital wallets is lower customer acquisition costs. Compared to the $1,000 on average that traditional financial institutions pay to acquire a new customer, digital wallets invest only $20 thanks to their viral peer-to-peer payment ecosystems, savvy marketing strategies, and dramatically lower cost structures.6 At the same time that consumers are abandoning bricks and mortar for on-line channels, occupancy expenses per bank branch have been escalating, hitting a record high of $550,000 as of 2018, as shown in Figure 2. In other words, the cost burden that branches place on traditional banks is increasing while their utility is decreasing.
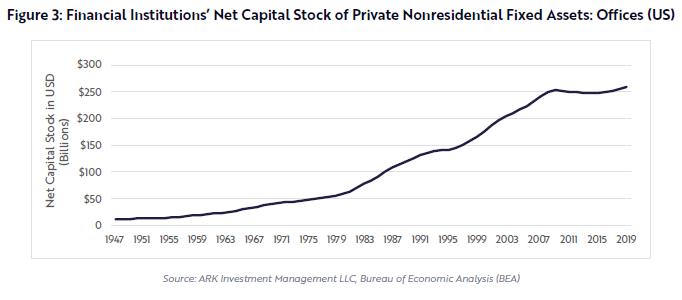
In our view, the 77,000+ bank branches in the US represent an untenable commitment to acquire customers for roughly $1,000 on average and monetize them. At best, as shown earlier in this piece, their customer acquisition is stagnating. In contrast, digital wallets are acquiring millions of customers at a cost 98% lower than that for banks, lowering the number of customers that banks can acquire and monetize, upending the unit economics of bank branches and transforming them into stranded assets. Diminishing the return on bank branch investment, digital wallets could put at risk the $260 billion of assets on financial institutions’ balance sheets, as shown below.
II. Brick and Mortar Retail
While in-store retail sales in the US peaked in 2015, the coronavirus pandemic has accelerated the shift to e-commerce.7 Last mile autonomous delivery could provide another boost, making e-commerce much more cost-effective and convenient. In our view, companies with large retail real estate footprints will continue to suffer from a decline in foot traffic.
Estimated Investor Exposure
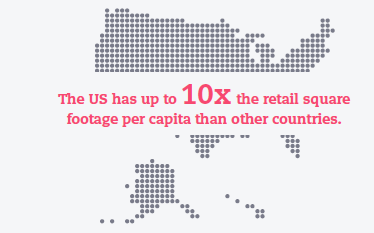
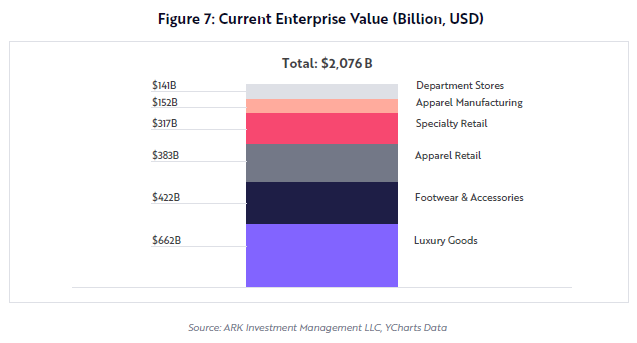
Most at risk is the $2 trillion of public enterprise value in Luxury Goods, Footwear & Accessories, Apparel Retail, Specialty Retail, Department Stores, and Apparel Manufacturing.8 With large real estate footprints, we expect their products will be caught in the crosshairs of the shift from brick and mortar to online retail. Retail-related fixed income investments will not be spared from this shift. ARK estimates that up to $1 trillion, or more than 40% of the $2.6 trillion in US commercial real estate values, could be repurposed in the shift to online commerce.9 The US has 5-10 times the retail square footage per capita of that in other countries.10
E-Commerce Is Accelerating
The coronavirus pandemic accelerated the adoption of e-commerce in the US from 11.3% of retail sales at the end of 2019 to 16.1% in the second quarter of 2020, the largest quarterly jump in history.11 ARK estimates that during the next few years drones will deliver packages for as little as 25 cents per trip, accelerating the shift in consumer shopping toward online purchases. In our view, as a percent of retail, global e-commerce will quadruple from 16% in 2019 to 60% in 2030 as drones add to its convenience. As a result, retail real estate values are likely to suffer.
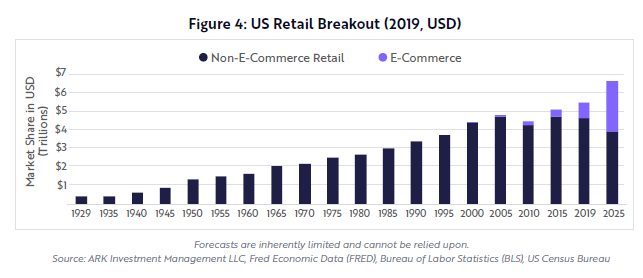
ARK estimates that US e-commerce will grow from $820 billion in 2019 to $2.7 trillion in 2025, pushing non-e-commerce retail down from $4.6 trillion to $3.9 trillion, a level last seen in the late 90s, as shown in Figure 4.
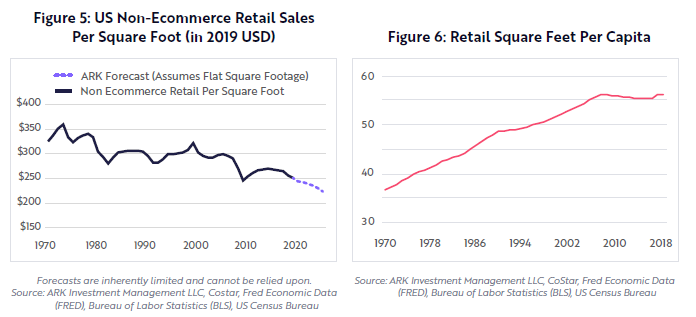
The US has more retail square footage per capita than any other developed nation, 5X that of the UK and 10X that of Germany.12 Moreover, even though retail sales per square foot in the US has been declining since the 1970s, retail square footage per capita has been increasing, as shown in Figure 5 and 6. If square feet were to stabilize at current levels, brick and mortar retail sales would continue to fall as e-commerce takes share. To push retail sales per square foot back to its peak, roughly $1 trillion worth of real estate would have to be repurposed by 2025.
We believe the brick and mortar retail apocalypse will continue to impact both equity and fixed income holders. ARK estimates that roughly $2 trillion in enterprise value is at risk in the public equity markets across the retail categories with heavy real estate footprints, as shown below.
While some companies will transition successfully to an e-commerce model, ARK expects more bankruptcies during the next 5-10 years as not every business will survive or cut retail assets quickly enough. In the fixed income markets, the performance of REITs with high exposure to retail real estate will continue to be at risk as their underlying assets become less valuable and will have to be repurposed. In ARK’s view, the decline in retail real estate values during the pandemic is a preview of what is to come.
III. Linear TV
Linear TV is real-time programming accessed over the air or by cable/satellite at scheduled times. While the primary delivery method of live programming in the US today, linear TV is giving way to over-the-top (OTT) services that deliver on-demand and live programming via the internet.
Offering thousands of channels for a seemingly low price, linear TV has not kept up with the times. Modern viewers want modern options. As a result, viewers have begun to “cut the cord”, canceling their linear TV services at an accelerating rate during the last few years. Without sports, the pace of cord cutting intensified during the pandemic.13 Nonetheless, as of the end of 2019 roughly 86 million US households still paid for linear TV.14 In our view, not for long!
Estimated Investor Exposure
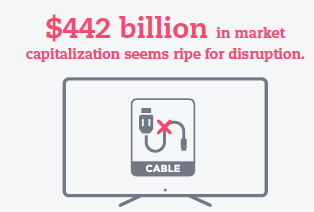
Linear TV revenue falls into two buckets – subscription and advertising. As of 2019, subscription revenue was roughly $89 billion per year and advertising $70 billion.15,16 At an enterprise value to subscription sales multiple of 3.44 and enterprise value to advertising sales multiple of 1.94, linear TV’s “subscription market cap” is around $306 billion and it’s “advertising market cap” stands at $135.8 billion.17 We believe that the $442 billion in linear TV subscription and advertising market capitalization is ripe for disruption.
Streaming Services Are Driving Cord Cutting
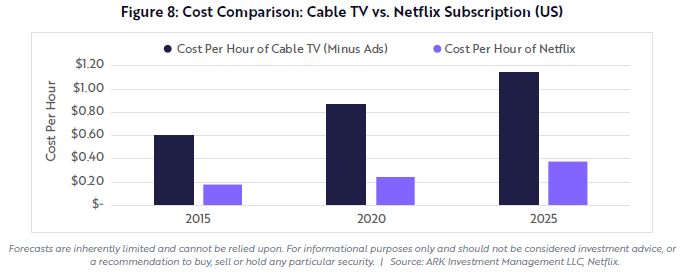
Starting with Netflix, the proliferation of on-demand viewing services has changed viewers’ perception of linear TV. Paying for 1,000+ channels, 90%+ of them never watched, now seems ridiculous. Not only is Netflix providing content at a 70% discount to cable providers, as shown below, it along with other streaming services like Disney+, HBO Max, and Amazon Prime Video match subscribers with specific content thanks to AI recommendation algorithms. We believe the better economic value and user experiences have paid off, so much so that linear TV providers are suffering from cord cutting at an accelerated rate.
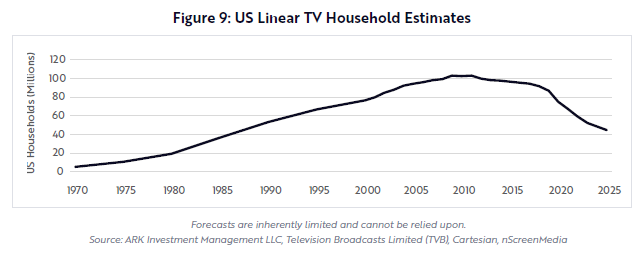
Disruptive innovation typically evolves slowly, until it hits a tipping point. Since peaking in 2011, the number of US linear TV households has been declining at an annual rate of 2.1%, a rate that we believe will accelerate to -15% at an annual rate during the next five years. Cumulatively, the number of US linear TV households could drop 48% from 86 million as of 2019 to roughly 44 million, a level last seen more than 30 years ago in the late 1980s.
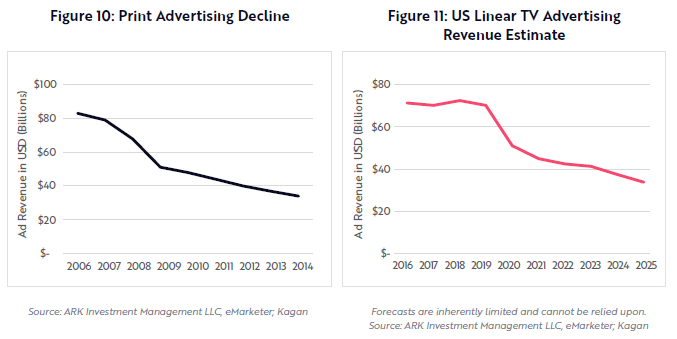
Despite eight consecutive annual declines in viewership, linear TV advertising revenue was relatively stable, until the sports drought and economic collapse during the coronavirus crisis clobbered it. In response to accelerated cord-cutting, we believe advertising on linear TV will drop faster than 11% at an annual rate, or 51% cumulatively, from $70 billion to $34 billion during the next six years. This shift is reminiscent of the demise of print media during the Global Financial Crisis in 2008-2009. After levitating for years in the face of readership declines, print advertising entered years of double-digit declines.
In conclusion, given its declining subscriber base and the plethora of new streaming options, we believe the end of linear TV is not an “if” but a “when”.
IV. Freight Rail
Based on ARK’s research, autonomous electric trucks will compete cost-effectively with freight rail and will offer better, more convenient service. Since the early 2000s, freight rail has been taking share from trucking and increasing prices. In our view, the commercialization of autonomous electric trucks will reverse both share and pricing dynamics, putting freight rail providers at risk.
Estimated Investor Exposure
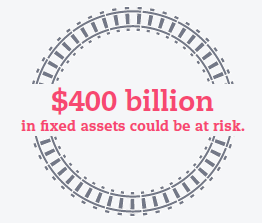
ARK estimates that if autonomous electric trucks undercut rail prices, more than $400 billion in fixed assets will be at risk, much of it in rail companies which account for $760 billion in total US public equity enterprise value and for 12.5% of the Industrials sector in the S&P 500.18
Electric And Autonomous Technologies Are Increasing Productivity
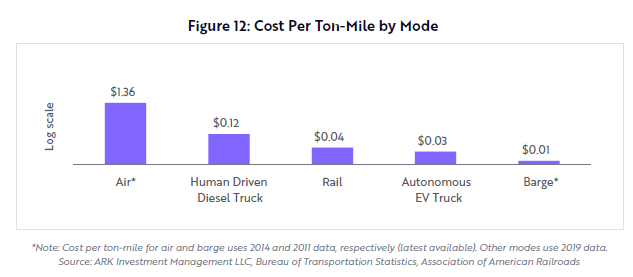
In our view, the combination of electric and autonomous technology will increase productivity and lower the costs of trucking dramatically. During the next five to ten years, ARK expects autonomous electric trucks to reduce the cost of trucking from 12 cents per ton-mile to 3 cents, undercutting rail prices with the help of lower electricity and maintenance, as shown below.
Trucks already offer faster and more convenient door-to-door service, so lower costs overall could be a significant blow to rails.
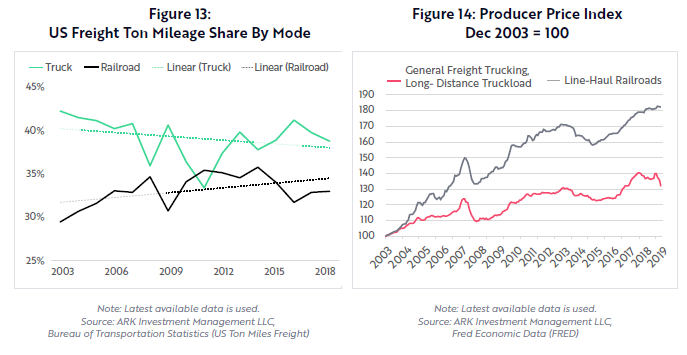
Rail’s market share and pricing have increased since 2003, as shown below. We believe both of these trends should reverse as more cost-effective autonomous electric trucks attract freight ton- miles at an accelerating rate.
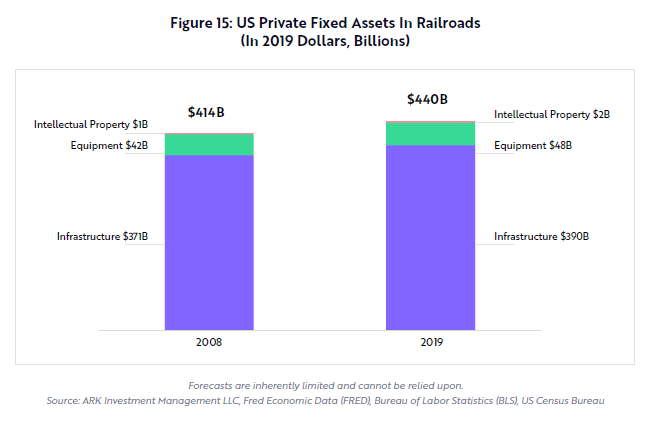
The shift toward autonomous trucks should spur consolidation in the trucking industry. Among the 500,000 trucking companies in the US, most are owner-operated with fewer than six trucks each.19 Autonomous technology is likely to submit to natural geographic monopolies given the massive data collection necessary to create successful platforms. Meanwhile, rail companies could face bankruptcy as they become much less price competitive. Since 2008, rail assets in the US - including intellectual property, equipment, and infrastructure – have increased to $440 billion on a constant dollar basis, as shown below.
Rail companies own most of this fixed asset base. The public rail industry accounts for roughly 12.5% in the S&P 500 and is worth $760 billion in total US public equity enterprise value.20 We believe that during the next five years, autonomous electric trucks will commercialize and take share from rail operators with more cost-effective, door-to-door service. If autonomous vehicles proliferate into various form factors, including flying drones and rolling sidewalk robots, we believe freight rail companies will have trouble competing with antiquated technology tied to dedicated infrastructure assets. ARK wonders which, if any, freight rail operators will survive.
V. Traditional Transportation
Robotaxis could reduce the cost of point-to point-mobility discontinuously in the US, stealing $150 billion in annual demand per year from ride-hailing, short-haul flights and public transit.21 If robotaxis become the dominant form of urban transit, ARK expects US auto sales to drop from 17 million units today to roughly 10 million by the end of the decade.22 We believe robotaxis will upend the market for traditional auto insurance, cutting annual premiums in half, and will disrupt the auto loan market as the legacy vehicle fleet, worth $2.6 trillion,23 suffers a material write-down in the value of its collateral. Finally, oil demand could peak much sooner than expected as electric robotaxi miles displace traditional auto miles.
stimated Investor Exposure
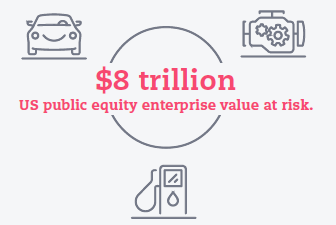
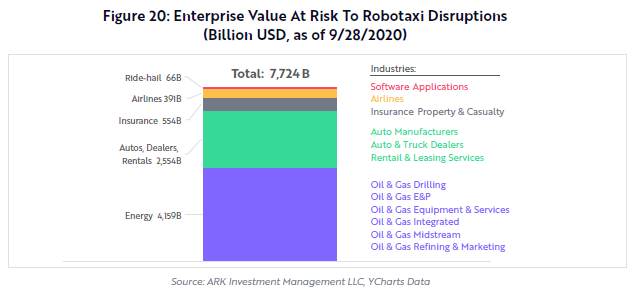
ARK estimates that robotaxis will put at risk the roughly $8 trillion of US public equity enterprise value24 in Energy, Autos, Insurance, Car Rentals, and Ride-hailing.
A Wave Of Disruption Is Rolling Through The Auto Industry And Beyond
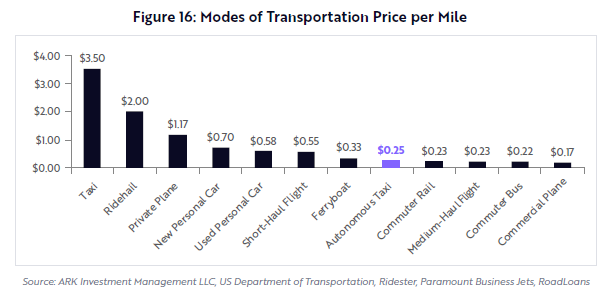
In our view, autonomous electric technology will cause a tidal wave of disruption not only in the auto industry but in many other industries. If battery system costs decline, we believe electric vehicle prices will follow, triggering mass market adoption. At the same time, autonomous driving systems could boost the utilization and lower the cost of transportation dramatically. ARK’s research shows that robotaxis could cost consumers just $0.25 per mile, less than half the cost of driving a personal car, half the cost of a short flight, and at a cost close to many public transit modes, as shown below.25 As a result, autonomous taxis could become the dominant form of personal transportation in urban areas, obviating the need for many consumers to purchase personal vehicles. According to ARK estimates, US auto sales will fall nearly 50%, from 17 million units today to just 10 million, during the next 10 years.26
Based on our research, also to decline is passenger air traffic. Robotaxis should offer more cost- effective and convenient door-to-door service alternatives to 1-3 hour flights, particularly when accounting for the drive to and from airports and the hassle of airport security lines. As a result, on the heels of the COVID-19 pandemic, ARK expects short-haul flight operators to suffer another blow, losing roughly 27%, or $28 billion, in revenues.27
Public transit, a $74 billion industry,28 is likely to suffer reduced ridership, placing additional strains on municipal revenues. Potentially offering more comfortable and convenient transportation, robotaxis could be an attractive alternative to mass market options priced only 1-3 cents lower per mile. While ride-hailing services pose a threat to traditional taxis today, autonomous ride-hailing could extend that threat to ferries, trains, and buses.
Once the disruptors, ride-hailing companies seem to be in the crosshairs of disruption today. ARK does not believe that any of them will be competitive with autonomous technology providers. Indeed, they could be forced to partner with the technology providers, offering little more than lead generation. As a result, ride-hail take rates could fall from 20-30% today29 to 5% or less, the autonomous technology platform providers capturing the difference and relegating them to minor participants in the mobility landscape.
If consumers shift from personal cars toward more cost-effective autonomous travel, they could begin to default on auto loans. The risks to auto loans, the asset-backed securities supporting them, and their underlying collateral are not well understood and could cascade through the global auto ecosystem. Autonomous electric vehicles could depress the residual value of gas-powered used vehicles significantly. Loans totaling $1.2 trillion support roughly $2.6 trillion in vehicles on US roads today, the balance of $1.4 trillion on consumer “balance sheets”.30 ARK anticipates that both consumers and lenders will have to write down these auto assets, casting a pall on auto-backed securities.
Auto insurance rates also could plummet. According to our research, not only will robotaxis be less expensive than personal transportation, but they also will be much safer than human-driven vehicles, reducing accident rates by more than 80%. Consequently, we expect the cost to insure them will be much lower. As robotaxis take to the roads, ARK estimates that roughly 57% of all automotive miles traveled in the US will be autonomous in the next 10 to 12 years and that non- autonomous miles traveled will drop by nearly 40%.
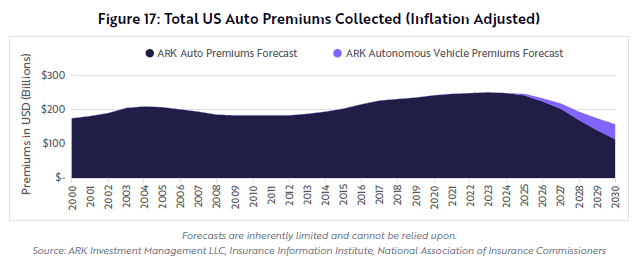
As shown in Figure 17, if autonomous travel gains traction, traditional auto premiums (excluding autonomous vehicles) could drop roughly 55% from an expected peak of $266 billion in 2023 to $122 billion by 2030. Moreover, insurance providers could lose their most valuable customers first if young drivers become early adopters of autonomous technology.
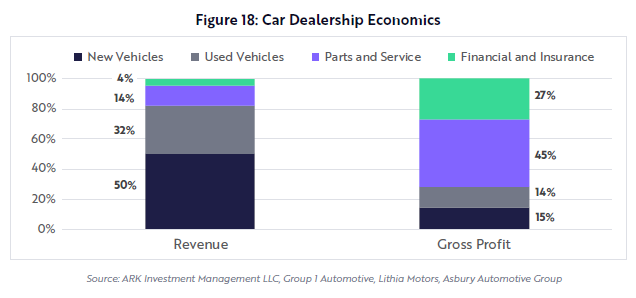
We believe traditional automakers and their dealer networks are in grave danger. The transition to autonomous electric platforms could create a winner-takes-most industry thanks to the massive amounts of data necessary to create autonomous driving platforms. As a result, the industry is likely to consolidate, with the survivors being those with successful autonomous technology and/ or electric vehicle platforms. Auto dealerships also could become casualties as service, financing, and insurance account for roughly 70% of their gross profits, as shown below. With much lower maintenance expenses relative to gas powered autos, EVs are likely to eat into dealer servicing businesses at the same time that default rates hit their financing businesses. Traditional auto manufacturers have significant balance sheet exposure to this disruption given the inexpensive financing they have provided to encourage sales. If auto loan delinquencies and defaults continue to rise, not only could dealerships go bankrupt, but auto makers could lose both their distribution networks and their ability to stimulate sales with bargain basement financing.
Finally, we believe the $4 trillion oil industry powering gasoline-guzzlers has seen its brightest days. Battery system cost declines could lower EV sticker prices to levels below those of their gas counterparts during the next two to three years, stimulating EV demand to levels well above current forecasts. While the EIA forecasts EV penetration of 2% in 2022,31 for example, ARK would not be surprised to see 20%. At the same time, inexpensive electric robotaxis could account for a disproportionate share of total miles traveled. Today, the capacity utilization of a personal car in the US is less than 5%, 10 times less than the 50% that we anticipate for robotaxis.32 Although we believe EVs will account for roughly 15% of the installed base in 2025, electric miles could total roughly 40% of total passenger auto miles traveled. Consequently, oil demand probably has peaked, as shown below.

ARK believes the market has not discounted adequately the robotaxi disruption likely to upend the traditional world order in transportation. Tallying up the risk to airlines, public transit, ride-hailing, insurers, automakers, auto dealers, rental companies, and oil, ARK estimates that roughly $8 trillion of enterprise value in the public markets is at risk, as shown below. In other words, long before dealers sell their last gasoline-powered car, we believe robotaxis will disrupt a dozen industries, destroying a meaningful percentage of portfolios tracking the broad-based benchmarks.
Footnote
- “Value Added by Private Industries: Finance, Insurance, Real Estate, Rental, and Leasing: Finance and Insurance as a Percentage of GDP.” FRED, 30 Sept. 2020, fred.stlouisfed.org/series/VAPGDPFI.
- Data sourced from third party source (Bloomberg).
- “2017 FDIC National Survey of Unbanked and Underbanked Households.” FDIC, www.fdic.gov/householdsurvey/.
- Wells Fargo public filings. Wells Fargo is the only major bank left disclosing checking account customers.
- Cash Card is Cash App’s debit card.
- “Digital Wallets Are Taking Share from Traditional Bank Branches.” ARK, 04/27/20, ark-invest.com/analyst-research/digital-wallets/; “Digital Wallet Companies Can Bank the Unbanked, Traditional Banks Can’t.” ARK, 05/08/20, ark-invest.com/analyst-research/digital-wallet-companies/. Note: All figures are in US dollars and the analysis is limited to the US banking market.
- ARK Investment Management LLC, “Federal Reserve Economic Data: FRED: St. Louis Fed.” FRED, Federal Reserve Bank of St. Louis, fred. stlouisfed.org/, “Consumer Price Index for March 2020.” Bureau of Labor Statistics, www.bls.gov/cpi/tables/supplemental-files/historical- cpi-u-202003.pdf; “US Census Bureau Retail Trade Monthly Retail Trade Survey Methodology Page.” Monthly Retail Trade Survey Methodology, 16 Jan. 2009, www.census.gov/retail/mrts/how_surveys_are_collected.html.
- ARK Investment Management LLC, YCharts Data.
- ARK Investment Management LLC, “Federal Reserve Economic Data: FRED: St. Louis Fed.” FRED, Federal Reserve Bank of St. Louis, fred. stlouisfed.org/, “Consumer Price Index for March 2020.” Bureau of Labor Statistics, www.bls.gov/cpi/tables/supplemental-files/historical- cpi-u-202003.pdf; “US Census Bureau Retail Trade Monthly Retail Trade Survey Methodology Page.” Monthly Retail Trade Survey Methodology, 16 Jan. 2009, www.census.gov/retail/mrts/how_surveys_are_collected.html.
- Peterson, Hayley. “The Retail Apocalypse Is Still in Its ‘Early Innings’ - and Thousands More Stores Will Close before It Ends.” Business Insider, Business Insider, 3 Oct. 2018, www.businessinsider.com/retail-apocalypse-is-still-in-early-innings-cowen-says-2018-10.
- Source: “US Census Bureau Monthly Annual Retail Trade.” 24 May 2012, www.census.gov/retail/index.html. “Estimated Quarterly U.S. Retail Sales (Adjusted): Total and E-commerce”
- Source: Peterson, Hayley. “The Retail Apocalypse Is Still in Its ‘Early Innings’ - and Thousands More Stores Will Close before It Ends.” Business Insider, Business Insider, 3 Oct. 2018, www.businessinsider.com/retail-apocalypse-is-still-in-early-innings-cowen-says-2018-10.
- Anderson, Matthew. “New Cord Cutting Insights Amid the COVID-19 Pandemic.” Roku, blog.roku.com/en-gb/cord-cutting-study-2020.
- “US Digital Video 2019.” EMarketer, www.emarketer.com/content/us-digital-video-2019.
- Subscription revenue forecast based on: Balderston, Michael. “U.S. Households With Pay-TV Services Drops to 75%, Says LRG.” TV Technology, 6 Nov. 2019, www.tvtechnology.com/news/u-s-households-with-pay-tv-services-drops-to-75-says-lrg. Advertising forecast based on: Sterling, Greg. “TV Ad Spending Has Peaked, Will Be Less than 25% of Total Pie by 2022 -- Forecast.” Marketing Land, 14 Nov. 2019, marketingland.com/ tv-ad-spending-has-peaked-will-be-less-than-25-of-total-pie-by-2022-forecast-271024.
- Full-year 2020 numbers are not yet available for subscription and advertising revenue, but ARK estimates $76 and $51 billion, respectively.
- “Revenue Multiples by Sector (US).” Price to Sales Ratios, pages.stern.nyu.edu/~adamodar/New_Home_Page/datafile/psdata.html.
- ARK Investment Management LLC; Data sourced from Y-Charts, Bureau of Labor Statistics (BLS) and Bloomberg.
- “Freight Solutions from US Special Delivery - Call US: (800) 821-6389.” Freight Solutions, 2 June 2020, usspecial.com/how-many-trucking- companies-in-the-usa/.
- Data Sources: YCharts Data and Bloomberg
- ARK Investment Management LLC, “Public Transportation Facts.” American Public Transportation Association, 6 Oct. 2020, www.apta.com/ news-publications/public-transportation-facts/, “Consumer Airfare Report: Table 1 - Top 1,000 Contiguous State City-Pair Markets.” US Department of Transportation, data.transportation.gov/Aviation/Consumer-Airfare-Report-Table-1-Top-1-000-Contiguo/4f3n-jbg2.
- Wagner, I. “U.S. Vehicle Sales 1978-2019.” Statista, 16 July 2020, www.statista.com/statistics/199983/us-vehicle-sales-since-1951/.
- ARK Investment Management LLC, “2017 Used Car Industry Report.” Niada, www.niada.com/uploads/dynamic_ areas/5Nd7sQuZuYjQ5FCDUBXL/34/UCIR RUNNING.pdf.
- ARK Investment Management LLC, YCharts Data, “National Data: Fixed Assets Accounts Tables.” BEA, apps.bea.gov/iTable/iTable.cfm?ReqID=10.
- Assumes short-haul flights are less than or equal to 700 miles.
- Lutz, Hannah. “2020 Vision: Lower but Stable Sales in the U.S.” Automotive News, 6 Jan. 2020, www.autonews.com/sales/2020-vision-lower- stable-sales-us.
- ARK Investment Management LLC, Consumer Airfare Report: Table 6 - Contiguous State City-Pair Markets That Average At Least 10 Passengers Per Day, US Department of Transportation, data.transportation.gov/Aviation/Consumer-Airfare-Report-Table-6-Contiguous-State-C/yj5y-b2ir.
- APTA, Public Transportation Facts, 2019, https://www.apta.com/news-publications/public-transportation-facts/
- “Big Ideas 2020.” ARK Invest, 29 Apr. 2020, ark-invest.com/big-ideas-2020/.
- ARK Investment Management, “Motor Vehicle Loans Owned and Securitized, Outstanding.” FRED, 7 Oct. 2020, fred.stlouisfed.org/series/MVLOAS.
- “Annual Energy Outlook 2019 with Projections to 2050.” US Energy Information Administration , www.eia.gov/outlooks/aeo/pdf/aeo2019.pdf.
- ARK Investment Management LLC, Average Annual Miles per Driver by Age Group, www.fhwa.dot.gov/ohim/onh00/bar8.htm.

ARK is a strategic partner of Nikko AM
About ARK
Headquartered in New York City, ARK Investment Management LLC is a registered investment adviser and privately held investment firm. Specializing in thematic investing in disruptive innovation, the firm is rooted in over 40 years of experience in identifying and investing in innovations that should change the way the world works. Through its open research process, ARK identifies companies that it believes are leading and benefiting from cross-sector innovations such as robotics, energy storage, DNA sequencing, artificial intelligence, and blockchain technology.
ARK’s investment strategies include: Autonomous Technology and Robotics, Next Generation Internet, Genomic Revolution, Fintech Innovation, 3D Printing, Israel Innovative Technology, and the overall ARK Disruptive Innovation Strategy.
©2020, ARK Investment Management LLC. No part of this material may be reproduced in any form, or referred to in any other publication, without the express written permission of ARK Investment Management LLC (“ARK”). The information provided is for informational purposes only and is subject to change without notice. This report does not constitute, either explicitly or implicitly, any provision of services or products by ARK, and investors should determine for themselves whether a particular investment management service is suitable for their investment needs. All statements made regarding companies or securities are strictly beliefs and points of view held by ARK and are not endorsements by ARK of any company or security or recommendations by ARK to buy, sell or hold any security. Historical results are not indications of future results.
Certain of the statements contained in this presentation may be statements of future expectations and other forward-looking statements that are based on ARK’s current views and assumptions and involve known and unknown risks and uncertainties that could cause actual results, performance or events to differ materially from those expressed or implied in such statements. The matters discussed in this presentation may also involve risks and uncertainties described from time to time in ARK’s filings with the U.S. Securities and Exchange Commission. ARK assumes no obligation to update any forward-looking information contained in this presentation.
ARK and its clients as well as its related persons may (but do not necessarily) have financial interests in securities or issuers that are discussed. Certain information was obtained from sources that ARK believes to be reliable; however, ARK does not guarantee the accuracy or completeness of any information obtained from any third party.